- (*)Function for KNN search:
Write a function knnSearch.m with the following usage:
[index, distance]=knnSearch(x, X, k) where- x: an input column vector of $d$-dimension
- X: a dataset matrix of $d$ by $n$, with each column being an observation (data point)
- k: no. of nearest neighbors to be retrieved
- index: a vector of k integers, representing the indices of the first k nearest neighbors (starting from the nearest one to the farthest one)
- distance: a vector of k element, representing the distances to these k nearest neighbors
- You can simply assume there is no ties in sorting the distance.
- Distance computation can be achieved by MATLAB command "norm".
Here is a test example:
- (*)Function for KNN search via Lp norm:
Write a function knnSearchLp.m with the following usage:
[index, distance]=knnSearchLp(x, X, k, p) where- x: an input column vector of $d$-dimension
- X: a dataset matrix of $d$ by $n$, with each column being an observation (data point)
- k: no. of nearest neighbors to be retrieved
- p: a positive constant to determine how to compute the distance of Lp norm. Note that $L_p(\mathbf{x})=\left(\sum_{i=1}^d |x_i|^p\right)^{1/p}$.
- index: a vector of k integers, representing the indices of the first k nearest neighbors (starting from the nearest one to the farthest one)
- distance: a vector of k element, representing the distances to these k nearest neighbors
- You can simply assume there is no ties in sorting the distance.
- Distance computation can be achieved by MATLAB command "norm".
Here is a test example:
- (*)About KNNC:
- What is the full name for KNNC?
- Please describe the basic principle of KNNC.
- Give the major strength and drawback of KNNC.
- (*)Voronoi diagram:
- Given 3 points in a plane, draw its Voronoi diagram.
- Given 4 points in a plane, draw its Voronoi diagram.
- (*)Single-layer perceptrons:
- What is the equation for computing the output of a 2-input single-layer perceptron?
- What are the learning rules of the 3 parameters in the above equation?
- (**)Surface and contour plots of 2D Gaussian distributions:
Write a script to draw both surface and contour plots of a 2D Gaussian distributions with the following parameters:
- m = [0, 0]T, S = [1 0; 0 1] (an identity matrix).
- m = [0, 0]T, S = [1 0; 0 5] (a diagonal matrix).
- m = [0, 0]T, S = [1 2; 2 5] (a positive-definite matrix).
- m = [0, 0]T, S = [-1 2; 2 -5]*50 (an arbitrary matrix).
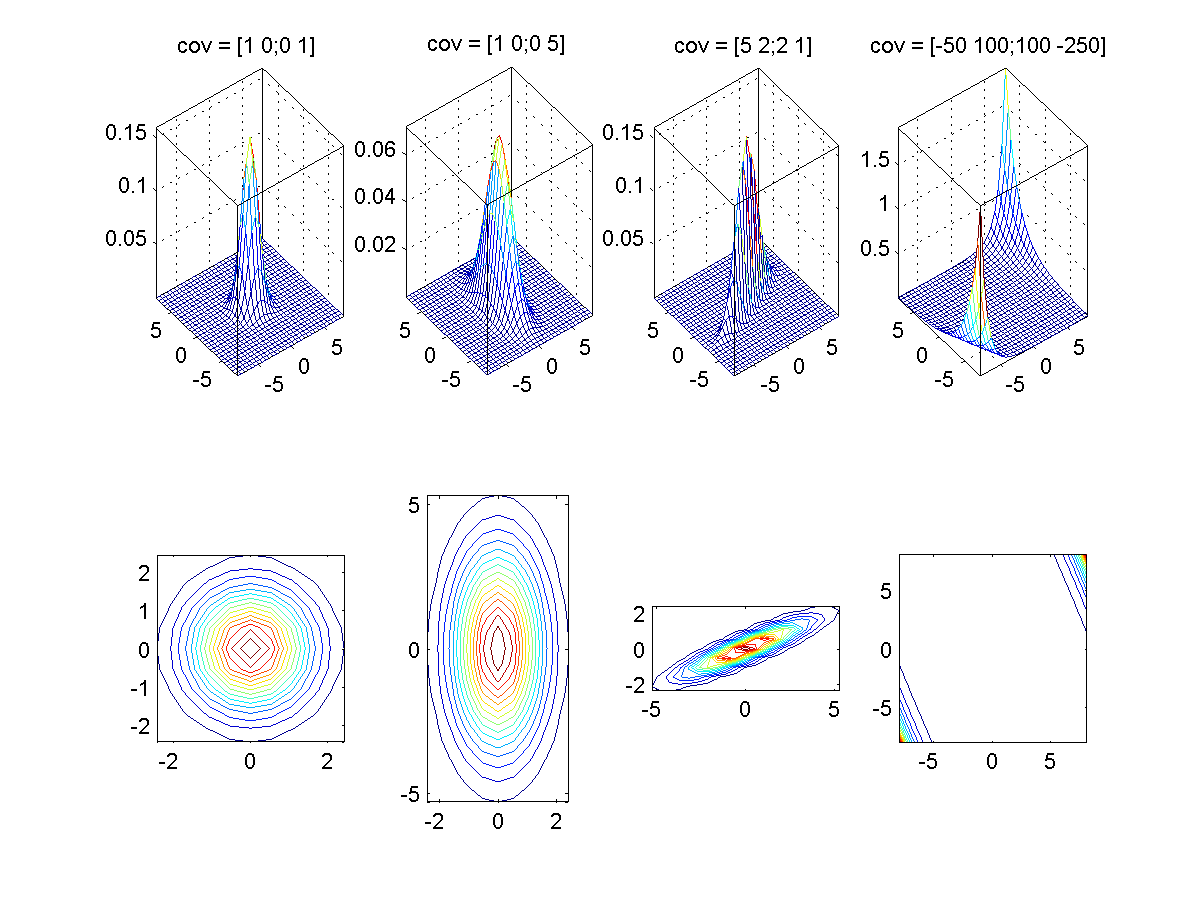
(Hint: You can follow the self demo part of gaussian.m.) - (*)Quadratic classifier:
- Why the classifier is named "quadratic"?
- How do you train a quadratic classifier?
- How do you evaluate (test) a quadratic classifier?
- What is the major strength of a quadratic classifier?
- What is the major weakness of a quadratic classifier?
- If a quadratic classifier has a diagonal covariance matrix, does it fall back to a naive Bayes classifier? Why?
- (*)Naive Bayes classifier:
- How do you train a naive Bayes classifier?
- How do you evaluate (test) a naive Bayes classifier?
- What is the major strength of a naive Bayes classifier?
- What is the major weakness of a naive Bayes classifier?
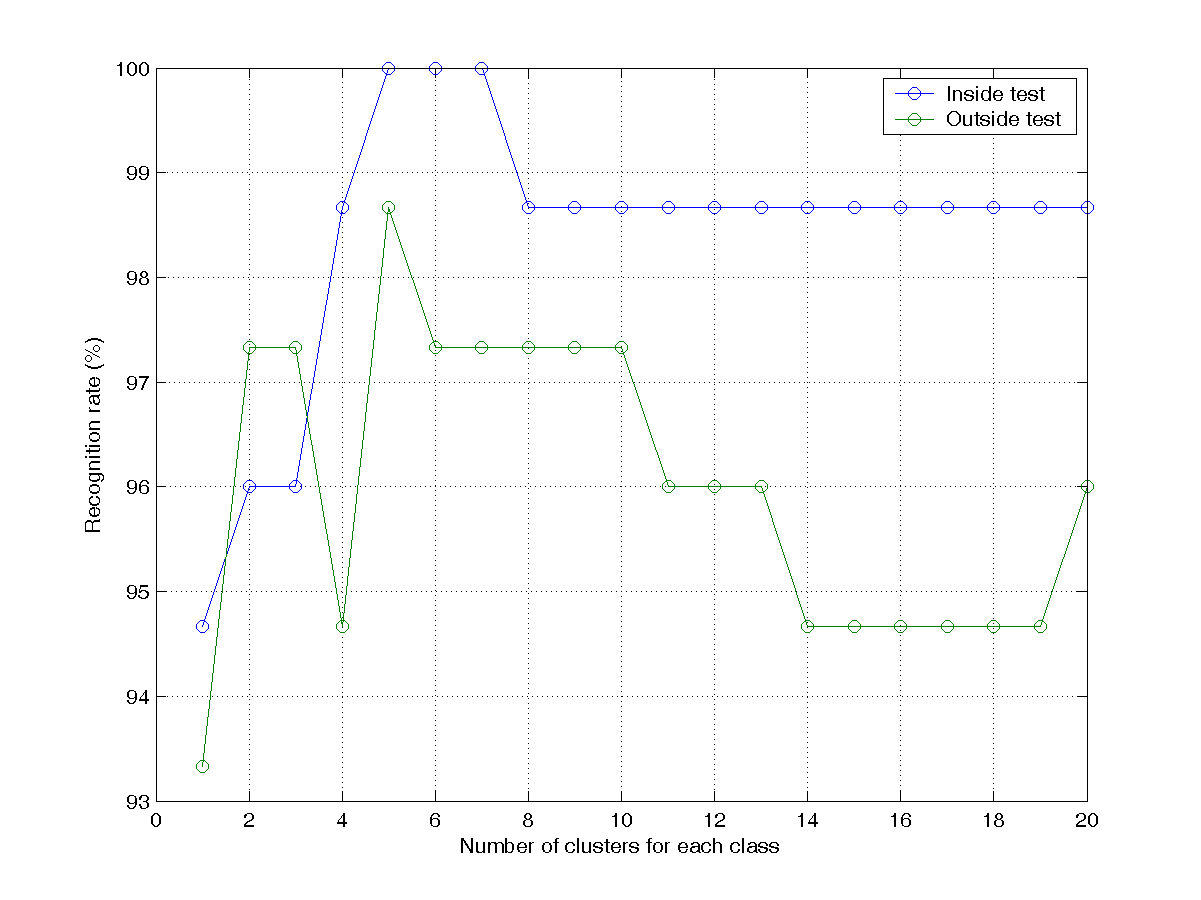
- (**)KNNC on IRIS: recognition rates w.r.t. number of clusters:
Please modify the example in order to test the recognition rates of KNNC with respect to the numbers of clusters.
- Write a script knncIrisRrVsClusterNum01.m to display the recognition rates for both inside and outside tests. Your plot should be similar to the one shown next:
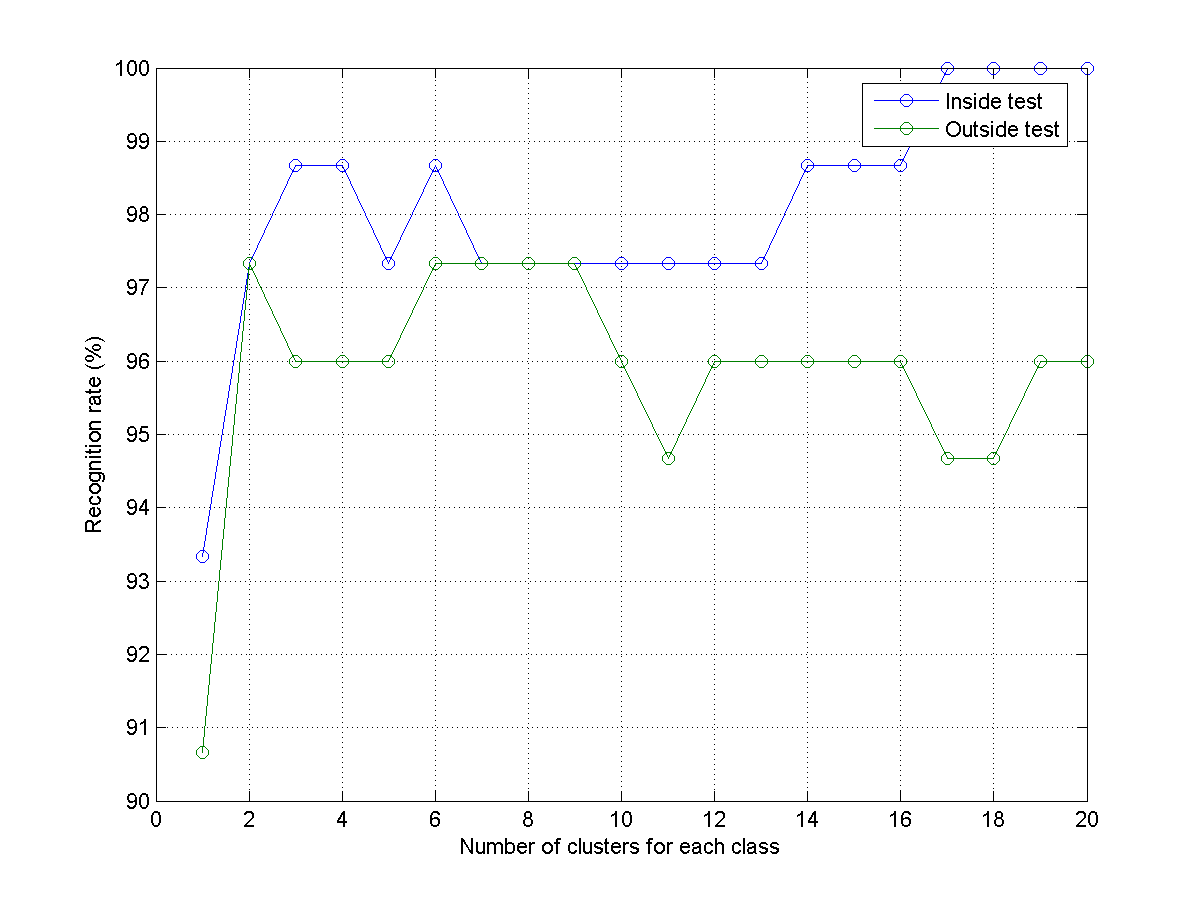
- Write a script knncIrisRrVsClusterNum02.m that repeats the previous subproblem but reverse the roles of training and test sets. Your plots should be similar to the one shown next:
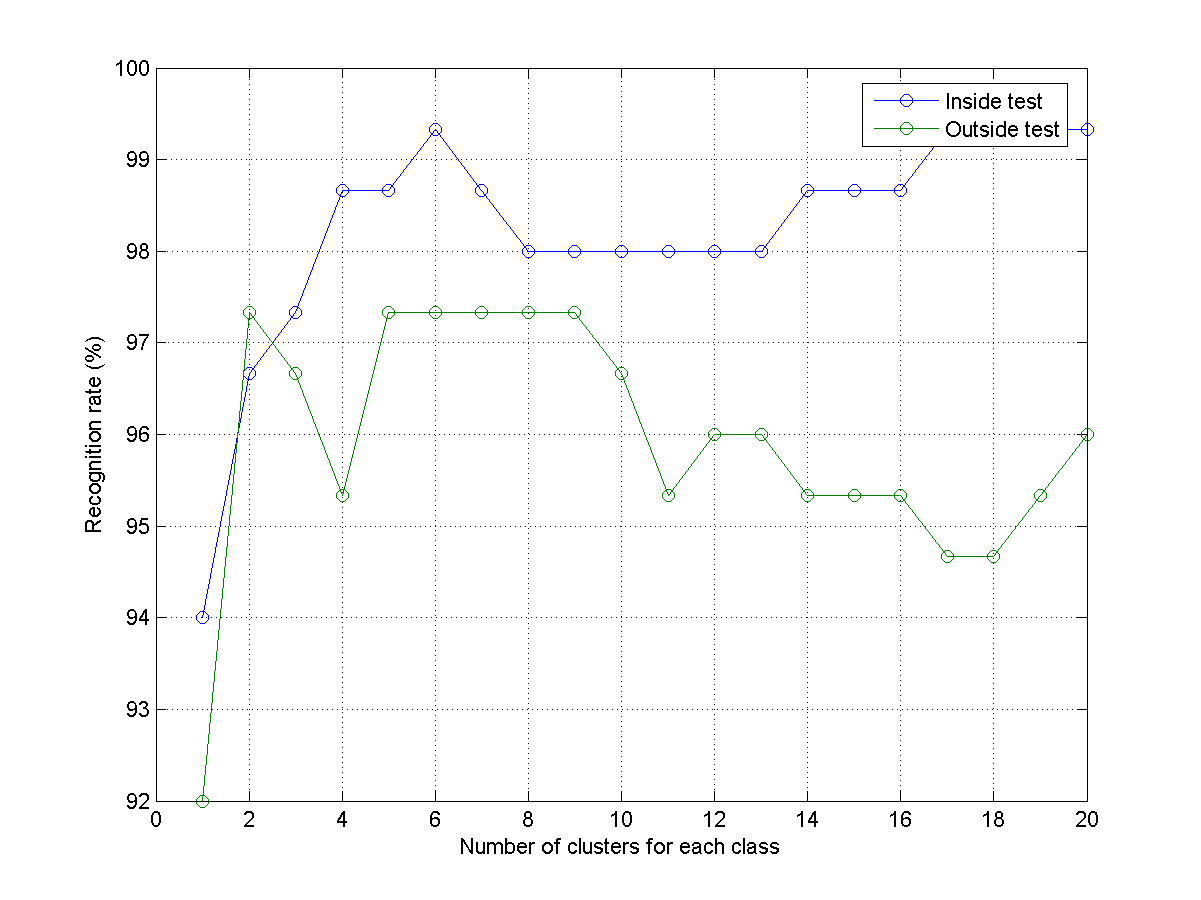
- Write a script knncIrisRrVsClusterNum03.m that combine previous two subproblems to plot the average recognition rates for both inside and outside tests. Your plot should be similar to the one shown next:
- Write a script knncIrisRrVsClusterNum01.m to display the recognition rates for both inside and outside tests. Your plot should be similar to the one shown next:
- (**)KNNC on WINE: recognition rates w.r.t. number of clusters: Use prData.m to obtain the WINE dataset and repeat the previous exercise to get 3 plots.
- (*)Various classifiers on WINE dataset:
Use prData.m to obtain the WINE dataset. Use the following classifiers to obtain the recognition rates of both inside and outside tests.
- Quadratic classifier.
- Linear classifier.
- (*)Various classifiers on ABALONE dataset:
Use prData.m to obtain the ABALONE dataset, in which the desired output is the age for abalones. Use the following classifiers to obtain the recognition rates of both inside and outside tests.
- Quadratic classifier.
- Linear classifier.
Data Clustering and Pattern Recognition (資料分群與樣式辨認)
